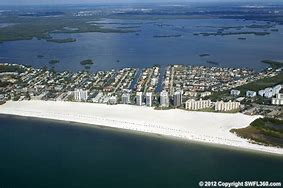
Ft. Myers Beach Real Estate Market Report

or Create your own market report

Educate Yourself on Market Values

The Biggest mistake home sellers can make when selling a home is also the most crucial to selling a house, PRICING. This is because if the home is priced too high than buyers won't look at it but if it's priced too low then sellers may be giving away profits.

Pricing a home to sell is part math, part science, and part art. A large part of pricing a house is understanding comparable sales, but there are other factors to consider. Market trends, demand, location, condition, marketing, and seasonality are just a few factors the may effect a homes value.

Market Reports

Market reports help you to understand the trends in the market, if demand is going up, down or sideways, and what seasons may be the best time to sell your home. You want to be educated when pricing your home so you can you can get the most money for your home while selling it in the quickest time possible. By utilizing the custom market report feature you can narrow down your search to find similar houses that have sold in your area.

If you would a detailed "Market Valuation" then we have experienced advisors waiting to assist you. Just hit the "Contact Us" tab at the top of the page and fill in your information.


Active Properties
Address Beds Baths Living ft2 List Price Cost per ft2 DOM
6100 Court Street 5 8 5,654 $13,490,000 $2,385 225 days
280 Estrellita Drive 6 9 5,810 $11,900,000 $2,048 20 days
6120 Court Street 4 6 4,278 $11,400,000 $2,664 39 days
61 Mango Street 6 6 5,780 $10,500,000 $1,816 23 days
938 San Carlos Drive 5 7 4,607 $7,895,000 $1,713 56 days
70 Avenue E 5 4 2,706 $6,995,000 $2,584 353 days
8223 Estero Boulevard 6 7 7,011 $6,950,000 $991 226 days
5256 Estero Boulevard 6 8 4,579 $6,850,000 $1,495 120 days
5224 Estero Boulevard 4 5 4,193 $6,750,000 $1,609 11 days
7974 Estero Boulevard 4 5 3,375 $6,350,000 $1,881 51 days
841 San Carlos Drive 4 6 4,004 $6,250,000 $1,560 25 days
160 Little Carlos Lane 4 6 4,095 $5,900,000 $1,440 54 days
793 San Carlos Drive 6 7 5,097 $5,485,000 $1,076 314 days
3050 Estero Boulevard 4 4 3,037 $4,899,000 $1,613 5 days
5300 Estero Boulevard N/A N/A 1 $4,850,000 Unknown 114 days
455 Palermo Circle 6 6 4,150 $4,740,000 $1,142 24 days
168 Chapel Street 5 7 3,751 $4,499,000 $1,199 263 days
5921 Estero Boulevard 4 5 4,392 $4,495,000 $1,023 277 days
5698 Estero Boulevard 5 6 3,051 $4,250,000 $1,392 89 days
260 Key West Court 3 4 2,485 $3,500,000 $1,408 65 days
8124 Estero Boulevard 4 5 2,893 $3,495,000 $1,208 86 days
8246 Estero Boulevard 3 3 2,236 $3,399,000 $1,520 46 days
205 Bayview Avenue 3 3 1,580 $2,875,000 $1,819 54 days
5575 Avenida Pescadora 3 3 2,614 $2,825,000 $1,080 54 days
3749 Estero Boulevard 6 6 3,031 $2,799,000 $923 87 days
Average: 3.4 3.2 2,101 $2,106,640 $33,650 155 days
Viewing 1 - 25 of 148
Properties Under Contract
Address Beds Baths Living ft2 List Price Cost per ft2 DOM
21471 Widgeon Terrace 5 3 3,819 $2,999,999 $785 46 days
8327 Estero Boulevard 4 3 2,289 $1,855,000 $810 250 days
12220 Siesta Drive 3 4 2,884 $939,990 $325 51 days
17741 Rebecca Avenue 3 3 1,974 $695,000 $352 109 days
Average: 3.8 3.2 2,741 $1,622,497 $568 109 days
Viewing 1 - 4 of 4
Viewing 1 - 4 of 4
Sold Properties
Address Beds Baths Living ft2 List Price Sold Price Cost per ft2 DOM Sold Date
15 Bayview Boulevard 4 10 4,038 $6,490,000 $5,940,000 $1,471 49 days 7/20/26
441 Estero Boulevard 4 4 3,248 $4,899,000 $4,500,000 $1,385 288 days 10/1/26
146 Miramar Street 6 4 2,988 $2,259,000 $2,200,000 $736 952 days 10/5/26
306 Seminole Way 4 3 2,936 $1,900,000 $2,097,998 $714 120 days 6/29/26
921 Prescott Street 4 4 3,558 $1,749,000 $1,650,000 $463 155 days 9/10/26
18160 Old Pelican Bay Drive 4 4 3,019 $1,299,000 $1,362,000 $451 6 days 8/5/26
104 Washington Avenue 5 3 2,100 $1,399,999 $1,300,000 $619 64 days 6/25/26
5650 Williams Drive 3 3 2,326 $1,500,000 $1,300,000 $558 91 days 6/29/26
246 Delmar Avenue 3 2 1,260 $1,300,000 $1,250,000 $992 71 days 7/31/26
5815 Estero Boulevard 3 2 1,431 $1,289,000 $1,150,000 $803 152 days 6/25/26
5612 Easy Street 3 3 1,540 $1,199,000 $1,100,000 $714 78 days 7/31/26
18195 Cutlass Drive 4 3 2,534 $1,095,000 $1,095,000 $432 425 days 7/27/26
8339 Estero Boulevard 3 2 1,880 $1,095,000 $1,055,000 $561 674 days 7/30/26
320 Madison Court 3 2 1,588 $1,260,000 $1,000,000 $629 77 days 8/25/26
11861 Isle Of Palms Drive 3 3 2,385 $1,049,999 $980,000 $410 116 days 6/30/26
16 Sunview Boulevard 3 2 1,554 $999,000 $955,000 $614 56 days 10/5/26
170 Pearl Street 3 3 1,663 $995,000 $925,000 $556 80 days 7/14/26
411 Connecticut Street 3 2 1,536 $839,000 $815,000 $530 84 days 8/11/26
11 Palmview Boulevard 2 2 1,312 $829,500 $805,000 $613 435 days 6/30/26
268 Ibis Street 3 2 1,568 $850,000 $800,000 $510 343 days 9/4/26
130 Madison Court 2 2 1,008 $850,000 $775,000 $768 135 days 8/17/26
26 Fairview Boulevard 3 2 1,543 $799,000 $750,000 $486 170 days 9/3/26
119 Andre Mar Drive 2 1 1,040 $715,000 $690,000 $663 204 days 10/15/26
4830 Coquina Road 3 2 1,544 $775,000 $675,000 $437 149 days 9/18/26
465 Donora Boulevard 3 2 1,429 $679,900 $660,000 $461 119 days 7/30/26
Average: 3.2 2.7 1,899 $1,313,168 $1,234,843 $605 248 days
Viewing 1 - 25 of 32

How much is your home worth?

...get instant property value now!